
Dairy processing effluents mostly include milk or milk products lost in the technological cycles (spilled milk, spoiled milk, skimmed milk and curd pieces); starter cultures used in manufacturing; by-products of processing operations (whey, milk and whey permeates); contaminants from the washing of milk trucks, tanks, cans, equipment, bottles and floors; reagents applied in CIP procedures, cooling of milk and milk products, for sanitary needs, in equipment damage or operational problems; and various additives introduced in manufacturing . Milk loss in wastewater is around 0.5–2.5% of processed milk, but it can increase to 3–4%
The wide variety of dairy products presupposes the existence of many wastewater types. However, three major categories can be outlined according to their origin and composition As mentioned in table, explained in the following chapters.
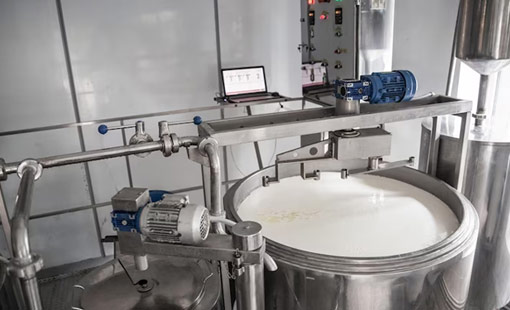
Processing water is formed in the cooling of milk in special coolers and condensers, as well as condensates from the evaporation of milk or whey. Milk and whey drying produces vapours which form the cleanest effluent after condensation although it may contain volatile substances as well as milk or whey droplets from evaporators. In general, processing waters lack pollutants and, after minimal pretreatment, they can be reused or discharged together with stormwater. Water reusage is possible for installations that are not in direct contact with derived products. Typical applications include hot water and steam production as well as membrane cleaning. The water from the cooling of products during pasteurisation after the last rinse of bottles and condensates generated in vacuum installations from secondary vapours can be utilised for room cleaning, lawn irrigation, etc.
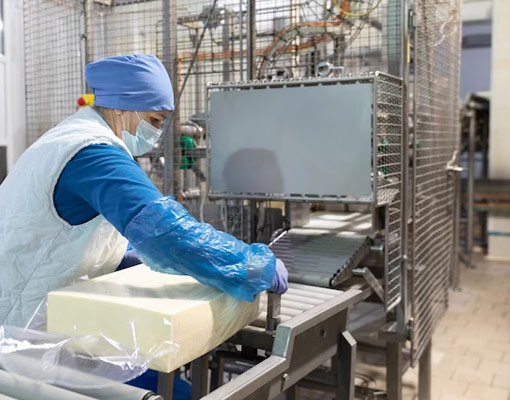
Cleaning wastewater Cleaning wastewater usually comes from washing equipment which is in direct contact with milk or dairy products. It also includes milk and product spillage, whey, pressing and brine, CIP effluents or equipment malfunction and even operational errors. Over 90% of organic solids in effluents come from milk and manufacturing residues: cheese pieces, whey, cream, water from separation and clarification, starter cultures, yoghurt, fruit concentrates or stabilisers. These effluents are in large quantities and are highly polluted, thus requiring further treatment. Additionally, the by-products of manufacturing processes, such as whey, milk and whey permeates, can also be grouped separately if they are collected individually from other wastewater streams.
The main pollutant in milk processing wastewater is whey due to its high organic and volumetric load. It represents about 85–95% of the milk volume and 55% of the milk components. Whey consists of carbohydrates (4–5%), mostly lactose. Proteins and lactic acid amount to less than 1%, fats to around 0.4–0.5%, while salts vary from 1 to 3%. Whey is produced mainly in cheese manufacturing, and its volume depends on the productivity of cheese and the type of processed milk – bovine, goat, sheep, etc.
On the basis of milk casein coagulation procedures, whey can be categorised as cheese whey and second cheese whey. Cheese whey is a by-product in the production of hard, semi-hard and soft cheese, after the addition of rennin to milk. Mild enzyme action produces sweet whey with a pH=6–7 (2, 28). Second cheese whey is a by-product in cottage cheese production after milk has been fermented, or curdled, with organic or mineral acids.
Due to strong acid conditions, whey develops an acidic taste, while the average pH value rarely exceeds 5. Scientific literature also discusses casein whey whose composition is very close to that of second cheese whey. Sweet and acid whey also differ in mineral and protein content. Milk and whey permeates are by-products in cheese manufacturing; they are produced during milk and whey ultrafiltration, respectively. Their solid content is lower; they are rich in soluble compounds, over 80% of which is lactose.
Dairy wastewater consists of complex constituents. Knowing the composition of milk and milk products, we can estimate better the wastewater contaminant loading. Although milk manufacturing produces waste streams analogous to milk and dairy product loss, every process gives an effluent unique in volume and composition.
Dairy wastewater volumetric and flow rates (depending on the production capacity and work shifts), as well as pH and total suspended solids (TSS) content (as a consequence of applied CIP methods) affect the efficiency of wastewater treatment management (1). It is important to know the quantity of the milk to be pasteurised, how much milk is processed into cheese and whether the entire obtained whey is discharged in wastewater or part of it is processed and reused (6). Contaminant concentrations in wastewater can be determined.
| Source | pH | BOD5 | COD | FOG | TS | TSS | TN | TP | Alkalinity as CaCO3 |
|---|---|---|---|---|---|---|---|---|---|
| Mixed dairy | 4–11 | 0.24–5.9 | 0.5–10.4 | 0.02–1.92 | 0.71–7 | 0.06–5.80 | 0.01–0.66 | 0–0.6 | 0.32–1.2 |
| Milk reception | 7.18 | 0.8 | 2.54 | 1.06 | – | 0.65 | – | – | – |
| Dairy/sewage=7:3 | 9.1±6.7 | 1.08–2.81 | 2.04–4.73 | 0.24–0.29 | – | 0.53–1.13 | – | 0.02–0.03 | – |
| Fluid milk | 5–9.5 | 0.5–1.3 | 0.95–2.4 | – | – | 0.09–0.45 | – | – | – |
| Yoghurt | 4.53 | – | 6.5 | – | – | – | – | – | – |
| Butter | 12.08 | 0.22–2.65 | 8.93 | 2.88 | – | 0.7–5.07 | – | – | – |
| Ice cream | 5.1–6.96 | 2.45 | 5.2 | – | 3.9 | 3.1 | – | 0.014 | 0.22 |
| Cheese | 3.38–9.5 | 0.59–5 | 1–63.3 | 0.33–2.6 | 1.92–53.2 | 0.19–2.5 | 0.018–0.83 | 0.005–0.28 | – |
| Cottage cheese | 7.83 | 2.6 | 17.6 | 0.95 | – | 3.38 | – | – | – |
| Cheese whey | 3.92–6.5 | 27–60 | 50–102.1 | 0.9–14 | 55–70.9 | 1.27–22.15 | 0.2–1.76 | 0.12–0.53 | – |
| Hard cheese whey | 5.8 | 9.48 | 73.45 | 0.99 | – | 7.15 | – | – | – |
| Soft cheese whey | 5.35 | 26.77 | 58.55 | 0.49 | – | 8.31 | – | – | – |
| Cottage cheese whey | 4.5 | – | 79 | – | 68 | – | 2 | – | – |
| Cheese whey wastewater | 4.6 | 35 | – | 0.8 | – | – | – | 0.64 | – |
| Whey processing effluent | 5–9 | 0.59–1.21 | 1.07–2.18 | – | – | 0.08–0.44 | – | – | – |
| Milk permeate | 5.55–6.52 | – | 52.94–57.46 | – | 11.61–15.39 | 1.94–3.4 | 0.3–0.4 | 0.35–0.45 | 2.5 |
| Condensate | 8.3 | – | – | – | – | – | 0.0006 | 0.0001 | – |
| Washing wastewater | 10.37 | 3.47 | 14.64 | 3.11 | – | 3.82 | – | – | – |
Due to their high organic content, represented mainly by rapidly assimilable carbohydrates and slowly degradable proteins and lipids, dairy wastewater is characterised by high BOD and COD values varying. It is known that there is a direct relationship between the ultimate 20-day BOD (BODu) and COD values in dairy wastewater.
About 90% of BOD and COD loading is caused by lactose, while protein removal contributes to only around 12% of the whey COD reduction. High lactose solubility increases soluble COD part, which is removed mostly by biological units. Like whey, milk and whey permeates have high COD load because they are rich in lactose, which excludes the possibility for a direct discharge in water bodies.
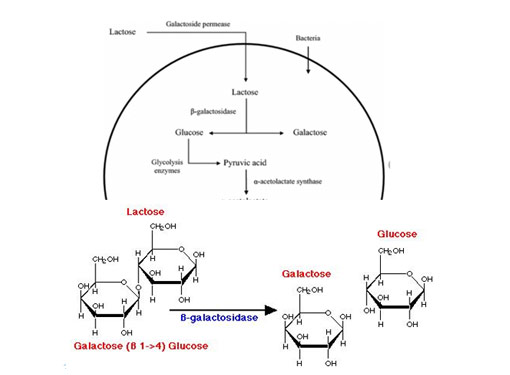
An enzyme is a globular protein with an active site which bind to substrate molecules and helps to catalyse a reaction by holding molecules in the correct spatial conformation for the reaction to take place. The activities of the enzymes are determined by their 3-dimensional structure. Most enzymes are much larger than the substrates they act on and only a small portion of the enzyme around 3-4 aminoacids is directly involved in catalysis.
Nanozyme are based on the latest advanced technology in biotechnology designed to meet the requirements of specific waste water treatment problems. Biological treatment method by Nanozyme microbes is the only method that can eliminate/degrade the waste problem. Specially selected and acclimated strains of microorganisms supplied in NANOZYME microbial enzyme products produce millions of times the levels of organic digesting catalysts produced by various type of microorganisms found naturally in different waste. Bacteria are living organisms that continually adapt and grow in the system.
Nanozyme Effective Microorganism (EM) is the consortia of valuable microorganisms which secretes organic acids and enzymes for utilization and degradation of anthropogenic compounds. Combination of various strains will successively promotes the growth of bacterial population, break down and digest the waste in both aerobic and anaerobic conditions to a far greater degree than single microbial strain. Bioremediation process involves detoxification and mineralization, where the waste is converted into inorganic compounds such as carbon dioxide, water and methane. When compounds are persistent in the environment, their biodegradation often proceeds through multiple steps utilizing different enzyme systems or different microbial populations.
Nanozyme microbial technique for Dairy industrial effluent degradation will be eco-friendly and is probably a lucrative alternative to physico-chemical processes. Nanozyme Microbial enzymes, viz. laccase and azoreductase, are cost-efficient, easily downstream processable, and effortlessly mobilizable. Nanozyme microbial enzyme conjugates are highly efficient to remove the Pollutant load.
The degradation of Dairy effluent by Nanozyme bacteria is facilitated by their oxidases. In the case of Lignin, Cellulose, starch, Glucanase & cellulobiohydralase plays the most vital role in degradation by breaking down the complex bonds.
Nanozyme Bacterial digestion is the process of bacteria, consuming organic & Inorganic matter. Enzymes act to break the organic & Inorganic matter into water soluble nutrients, which the bacteria digest. Using complex chemical reactions, the organic & Inorganic waste is metabolized down to water and carbon dioxide (the final metabolic waste products), providing the bacteria with energy for growth and reproduction. It may be simply shown by the following equation:
Organic waste + Water Soluble Nutrients —–Bacteria + oxygen—> water + carbon dioxide
Organic waste + Water ——Enzyme—-> Water Soluble Nutrients —–Bacteria—> Water + Carbon Dioxide
We are using our product nanozyme in aeration tank capacity which means the ammonical nitrogen totally converted into nitrate nitrogen. It’s an available intake form to our bacteria. So totally we can eliminate the odour and control the ammoniacal nitrogen…. odour is because of ammonical and hydrogen sulphide. No need to remove condensate.
Note that a total ammonia value (NH3 + NH4) cannot be trivially converted from “nitrogen” to “ion” form or vice versa. The total ammonia value must first be broken into component NH3 and NH4 values, then converted individually to NH3-N and NH4-N and added together.
Ammonia removal is a strictly aerobic biological process. Technically, bacteria convert ammonia (NH4 ) to nitrate (NO3 ); it isn’t really “removed.” Nitrification only works on ammonia (NH4 ). Organic-nitrogen is not converted directly to nitrate (NO3 ); it must first be converted to ammonia (NH4 ), and the ammonia (NH4 ) converted to nitrite (NO2 ) and then nitrate (NO3 ).
Organic / Inorganic pollutant load is consumed by the bacteria, used as nutrients by the bacteria, and is no longer present to produce odours, sludge, pollution, or unsightly mess.
The removal of pollutants from the Effluent by using NANOZYME (Effective Microbes (EM)- bacterial consortium manufactured in BIONICS ENVIRO TECH having potential to degrade all organic and inorganic compounds present in the Effluent.
When degradation Organic and inorganic take place which will automatically lead to reduction of COD, When COD takes places which will reflect BOD, Colour, smell and etc parameters.
| S.No | PRODUCT DESCRIPTION | UNIT | Quantity |
|---|---|---|---|
| 01 | NANOZYME BET-ETP-7003 | Kgs | |
| 02 | NANOZYME BET-NUTRI-9003 | Kgs |
REQUIRED MATERIALS FOR PREPARATION:
NANOZYME INCUBATION METHOD:
| Dosage | Day of Dosage | From litres of prepared broth Volume of Nanozyme Application to Aeration |
|---|---|---|
| 1st Dosage | 1st to 10 days | Litres / Day |
| 2nd Dosage | 11th to 20th Days | 0 Litres / Day |
| 3rd Dosage | 21st to 30th Days | 0 Litres / Day |